What Do We Know About the Children of Shelby County?
Chapter One made the case that the first three years of a child’s life are a time of incredible growth—physically, mentally, socially, and emotionally. This chapter drills down to focus on the children of Shelby County and their families, and on those factors that may influence the development of social and emotional competencies already described.
This chapter includes maps of Shelby County to show how these factors are spread out across the county. The map above provides information on the relative location of zip codes within Shelby County.

How Many Children Live in Shelby County?
There are many young children in Shelby County. The 240,133 children in the county (under the age of 18) represent about one-quarter of the total population (26 percent), with a fairly even distribution across the age range (Figure 2.1). Children under six (82,202) account for just under nine percent of the total population.
Within the City of Memphis, (163,322) children make up about one-quarter of the total population. Children under six years of age (59,662) account for 9 percent of the total Memphis population.
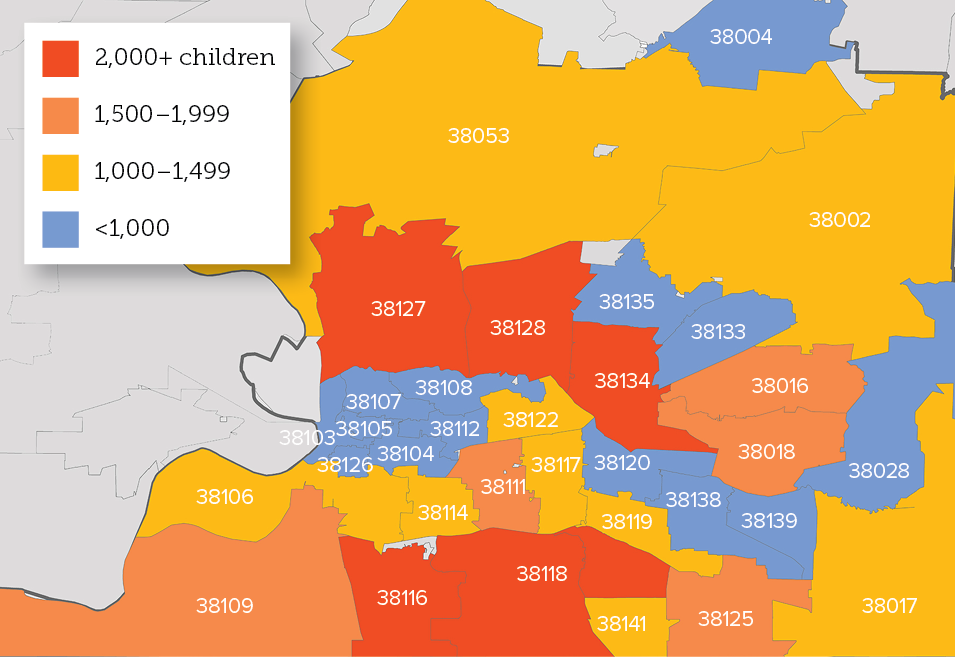
But where children live within Shelby County varies. The map on the next page (Figure 2.2) displays the distribution of children under the age of three by zip codes. Understanding the geographic distribution of children and the distribution of potential risk factors across Shelby County is useful for informing resource allocation decisions. The zip codes with the highest number of children cluster in three regions within the county, one to the south (zip codes 38115, 38116, 38118, 38109, 38111, 38125), one to the north (zip codes 38127, 38128), and one to the east (38018, 38016, 38134).
What do we Know About the Health of Newborn Children?
In 2013, approximately 13,760 babies were born in Shelby County.
While most are born healthy, many are born too early or too small. Infants born preterm (less than 37 weeks gestation) and at low birth weight (less than 2,500 grams or 5.5 pounds) are at greater risk for physical and developmental health problems, from poor lung functioning and language delays to infant death (death occurring in the first year of life).
Preterm Birth can Affect Development.
In addition to physical problems, children born early tend to have more behavioral and social difficulties in the first few years of life 14.
Early birth affects the structure of the brain. When a baby is born early, the parts of the brain that receive, transfer, and store information have not had time to fully develop 15. Why? At 34 weeks gestation, a baby’s brain is only about 65 percent of the weight it would be if the baby were full-term (40 weeks). Preterm birth can also make child-parent bonding difficult because children born early often spend their first days, weeks, or months in the hospital, separated from their parents 15.
Preterm babies
- may have low birth weight
- may have poorer cognitive outcomes
- may have behavioral problems, be shy or withdrawn
Full-term babies
- may still have low birth weight if mother has high blood pressure; uses drugs, alcohol, or tobacco; or does not gain enough weight during pregnancy
- may still have low birth weight if born with a congenital or genetic problem
Data Facts:
- In 2013, 13 percent of babies born in Shelby County were preterm (1,790). While this percentage has remained relatively stable over time, it consistently hovers above the national figure of 12 percent.
- More black babies in Shelby County are born preterm (15 percent) than white babies (9 percent).
Source: Tennessee Department of Health, Division of Policy, Planning and Assessment, Office of Health Statistics. Number of live births with number and percentage preterm, by race of mother and county of residence of mother, Tennessee, 2013
Low Birth Weight Remains High in Shelby County.
Babies born early may have low birth weight. However, full-term babies can also be born with low birth weight if their mothers have high blood pressure; use drugs, alcohol, or tobacco; or do not gain enough weight during pregnancy. Children with low birth weight have poorer cognitive outcomes 16 and may also have behavioral problems, a harder time regulating their emotions, or be shy or withdrawn 17. Nationally, about 3 percent of full-term babies were born with low birth weight in 2012.
When children have these difficulties, it can make parent-child bonding difficult (consider the hard-to-soothe child described in Chapter One). Low birth weight can also negatively influence how a child reacts to stress, making him or her more difficult to nurture.
Learn more about low birth weight
Data facts:
- In 2013, 1,611 babies (12 percent) in Shelby County were born with low birth weight. This is above the national average of 8 percent and the Healthy People 2020 goal of 8 percent.
- More black babies in Shelby County are born with low birth weight (15 percent) than white babies (7 percent).
Source: Tennessee Department of Health, Division of Policy, Planning and Assessment, Office of Health Statistics. Number of live births with number and percent low birthweight, by race of mother and county of residence of mother, Tennessee, 2013

What do we Know About the Families of Young Children?
Family and experiences at home influence a child’s social and emotional development.
Children’s Ethnic and Cultural Backgrounds Influence Their Development.
Children’s early life experiences are shaped, in part, by the backgrounds, cultures, languages, and beliefs of their families. By understanding these factors, we can ensure that support provided to the children and families of Shelby County is culturally and linguistically diverse, and is respectful of culture and beliefs.
Learn more about culturally responsive parenting
The distribution of children by race and ethnicity in Shelby County (Figure 2.3) is different than the United States overall. Nationwide, about 68 percent are white, about 14 percent are black, and 5 percent are Asian, with the remaining 14 percent reporting another race, or two or more races.
By ethnicity, about 9 percent of children in Shelby County and 10.9 percent in Memphis are Hispanic. Further, about 9 percent of individuals over age five speak another language in their home (Figure 2.4).
Source: U.S. Census Bureau, American Community Survey 1-Year Estimates 2013, Table B01001I

Poverty affects social and emotional development.
Children are one of the poorest groups in the United States 17. Poverty can affect a child’s development in different ways 17, 18. Parents without stable and adequate incomes are less able to provide their children with stimulating environments, including books, educational toys, and enriching activities 19, 20. Poverty is associated with other factors that negatively affect children’s development. These factors might include unsafe environments, reduced access to healthy foods, and low-quality child care 21. Poverty can also influence the social and emotional development of children by increasing stress and strain on families. This additional burden on caregivers makes it challenging to provide the nurturing parenting that children need to thrive in stressful environments.
The terms “poor” and “in poverty” are applied to families with annual incomes below the Federal Poverty Level (FPL) set by the U.S. Department of Health and Human Services. In 2013, the FPL for a family of four was $23,550.
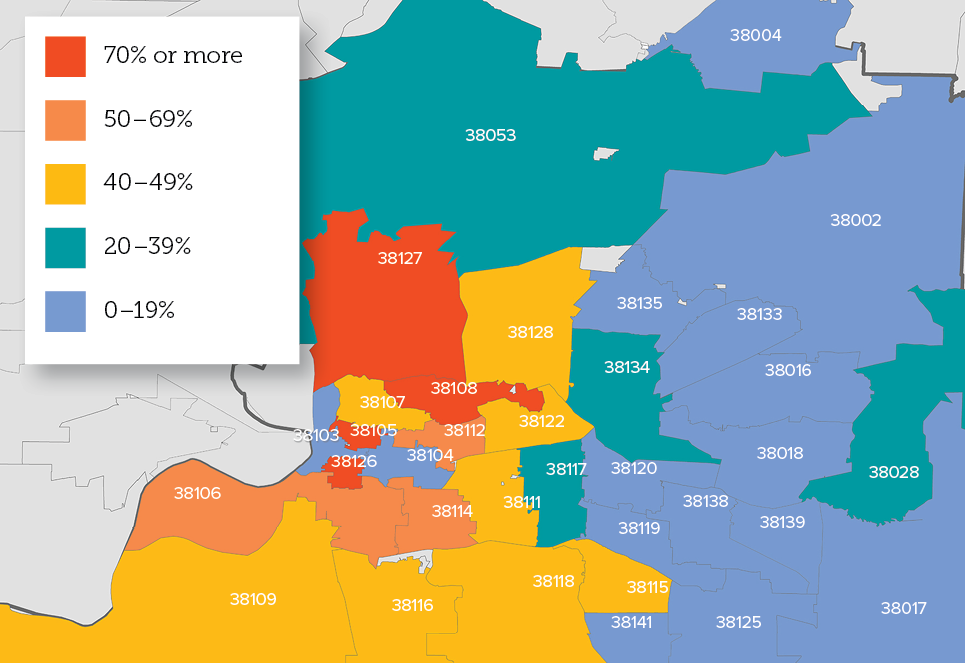
In 2013, more than one-third (40 percent) of children under the age of six in Shelby County lived below the FPL. In contrast, about a quarter (25 percent) of children under the age of six lived in poverty nationally in 2013. Areas of Shelby County to the north (38107, 38108, 38127, 38128) and south (38106, 38109, 38115, 38116, 38118, 38126) have the largest percentages of children under age six living in poverty, along with a few spots in the county’s center (38105, 38111, 38112, 38114, 38122) (Figure 2.5).
U.S. Census Bureau, American Community Survey 5-Year Estimates 2008–2012, Table B17024
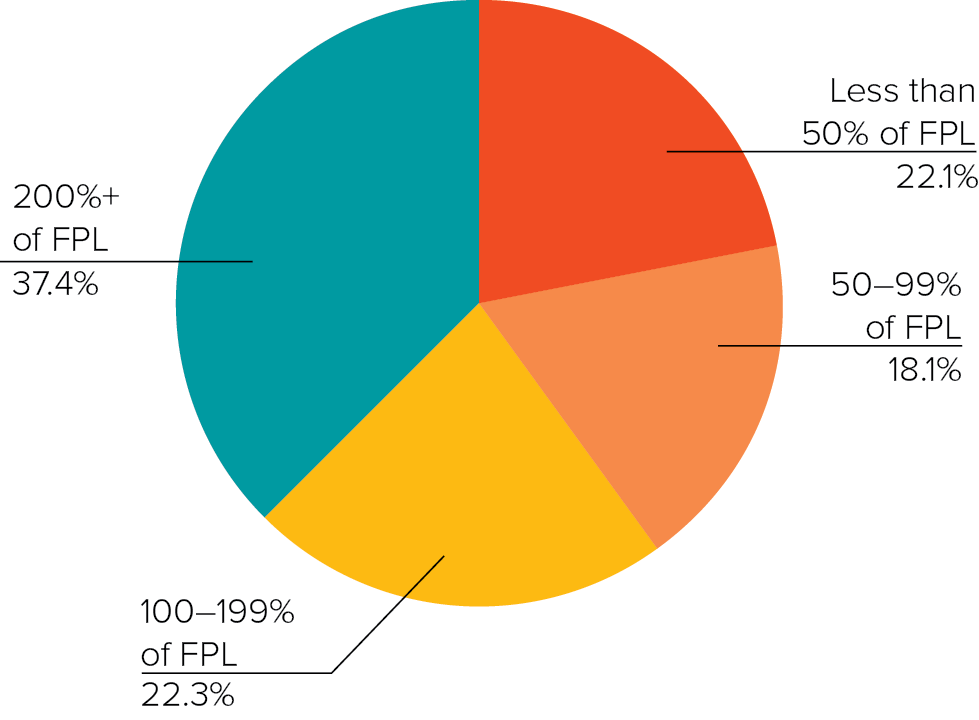
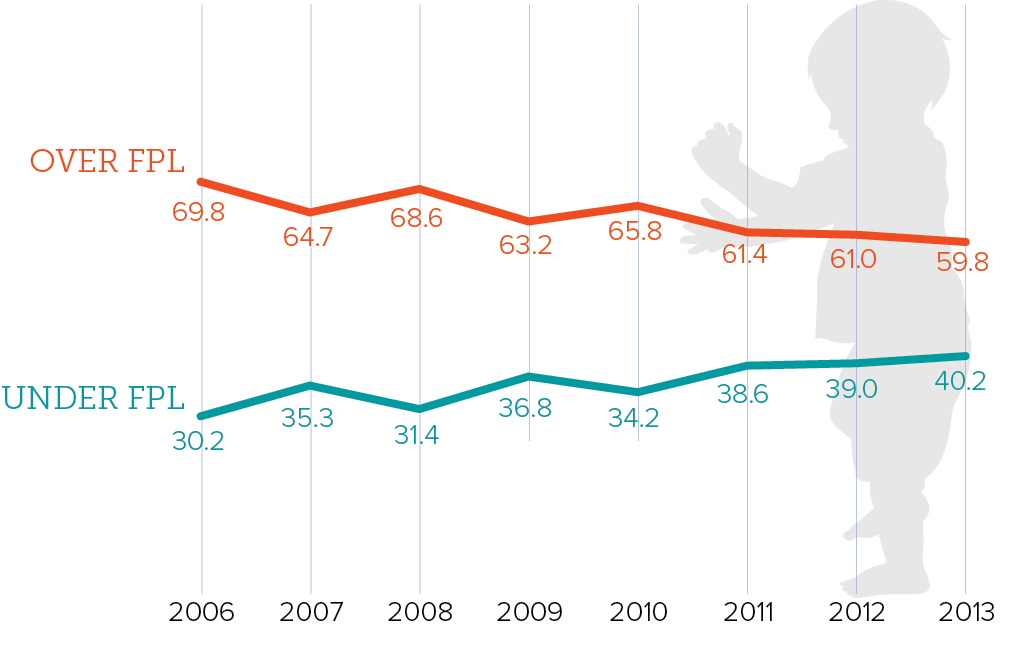
Not all poor children experience the same types of hardship, however. Some children live in extreme poverty (defined as an income that is less than 50 percent of the FPL) (Figure 2.6). Other children live just above the FPL—but not by much—and face challenges similar to those living below the FPL. These children, in families with incomes between 100 and 199 percent of the FPL, are also quite poor, resulting in similar stresses and strains and fewer resources to create an enriching environment for the children.
The percentage of children in Shelby County living in poverty has increased over time (Figure 2.7). More concerning is that this is driven largely by increases in the numbers of children living in extreme poverty, below 50 percent of the FPL.
Parental education also influences social and emotional development.
There are strong links between parent education and poverty. Parents with more years of schooling are more likely to get higher-paying and stable jobs. As a result, these parents may have more time and resources to provide a stimulating home environment for their children. For example, they are more likely to read more with their children and use a larger vocabulary when talking with them 22. Mothers with higher levels of education also tend to display greater warmth and responsiveness to their children, like positive reactions when the child does something good or new, or hugs when the child is distressed, which contributes to fewer behavior and emotional problems 22.
In contrast, children whose parents have less education may not benefit from these advantages and are less likely to meet some of the major milestones of social and emotional development outlined in Chapter One.
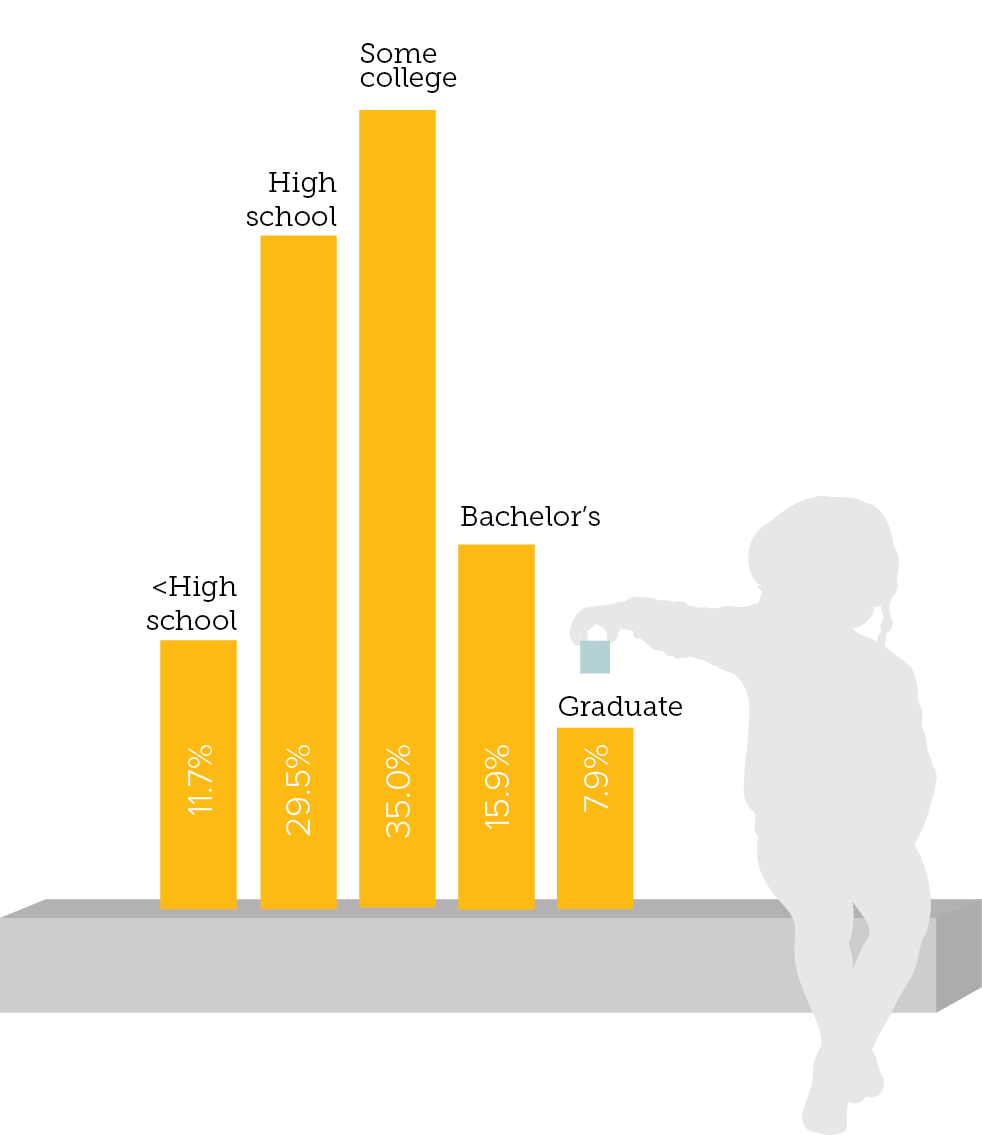
Within Shelby County, about 40 percent of women who gave birth within the past 12 months had less than or equal to a high school diploma. About a third had completed some college, and about 25 percent earned a bachelor’s degree or higher (Figure 2.8).
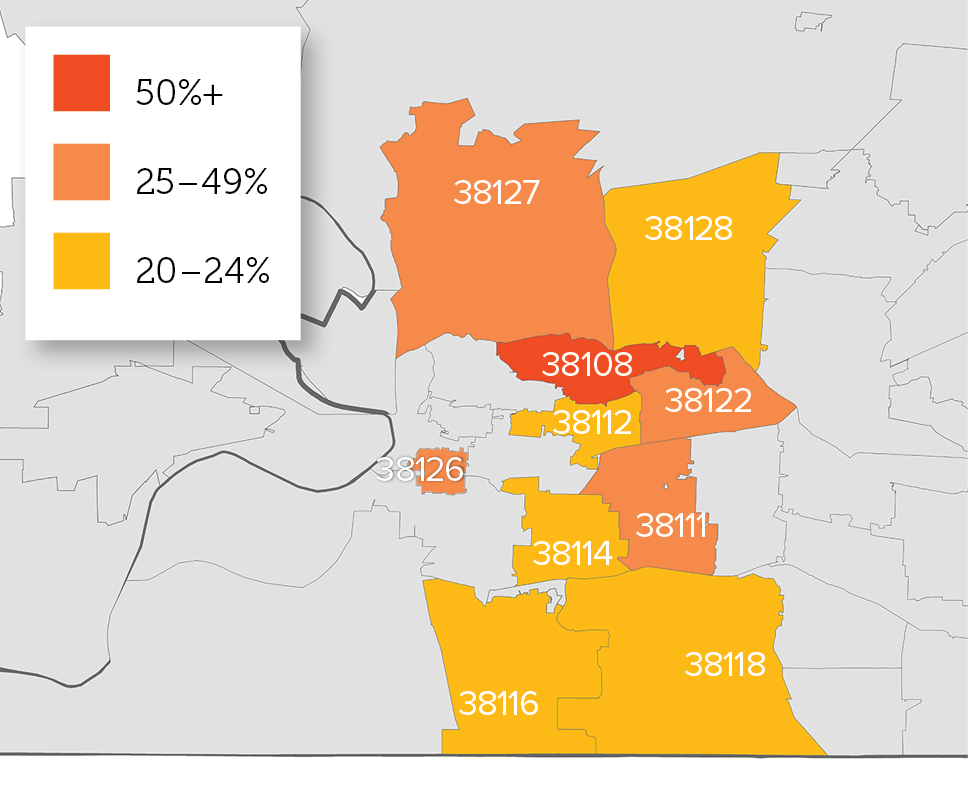
While this distribution is similar to the United States overall, within Shelby County there is significant variability as to where these mothers live. For instance, zip code 38108 has the highest concentration of new mothers with low education—more than half did not graduate from high school. As shown in Figure 2.9, there are a number of areas in Memphis where the percentage ranges from 20 percent to 49 percent.

More than half of children in Shelby County live in single-parent households.
In Shelby County, more than half (56 percent) of all children under six live in families headed by an unmarried parent (Figure 2.10). Children who live in single-parent households tend to have greater behavioral and emotional problems than children who live in two-parent households. This risk is even higher for children who have lived with a single parent since birth 23, 24. While many single parents are trying to do their best under difficult circumstances, many have fewer financial resources and may also have less support from friends or family to help out in times of need. This can increase parental stress, which may negatively affect parent-child interactions.
Data fact:
- In 2013, 49 percent of children in Shelby County under the age of 18 were living in single-parent households. This varied among zip codes and ranged from a low of 9 percent to a high of 96 percent. In zip code 38126, almost every child lived with only their mother or father.
Source: U.S. Census Bureau, American Community Survey 1-Year Estimates 2013, Table B09002
Did you know?
- Just under 5% of children under the age of 18 have a grandparent living with them.
- In Shelby County, about 23,000 grandparents have one or more of their grandchildren living with them. About half are serving as the grandchild’s primary caretaker or guardian.
Source: U.S. Census Bureau, American Community Survey 1-Year Estimates 2013, Table B10050
Did you know?
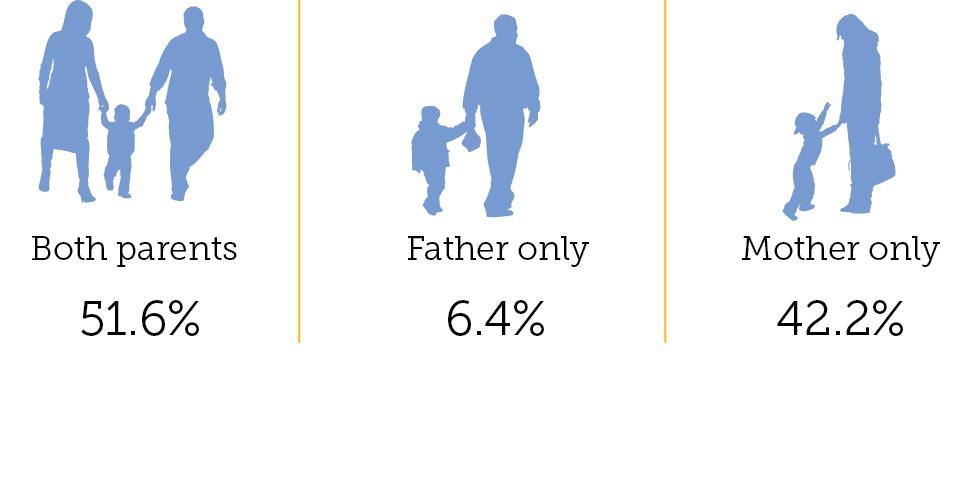
- If a child is living with only one parent, it is more common for him/her to live with his/her mother, but many children live only with their father (Figure 2.11).
- Areas where more than 10 percent of children live only with their father include: 38114 (19 percent), 38122 (13 percent), 38106 (12 percent), 38119 (12 percent), 38134 (12 percent), 38107 (11 percent), and 38053 (11 percent).
Source: U.S. Census Bureau, American Community Survey 5-Year Estimates 2008–2012, Table B09002
Children born to teen mothers are at increased risk for poor social and emotional outcomes.
Though the rates of teen pregnancy are declining, having a child early in life affects maternal education and job opportunities. Given that many teenage mothers will raise their children primarily on their own as single mothers, these challenges often result in fewer resources, added stress, and lowered social support for the mother. Teen parents are also less likely to receive timely prenatal care due to the unexpected nature of their pregnancies, which can have implications for their developing babies 25. All of these factors have the potential to negatively affect children’s social and emotional development.
Data facts:
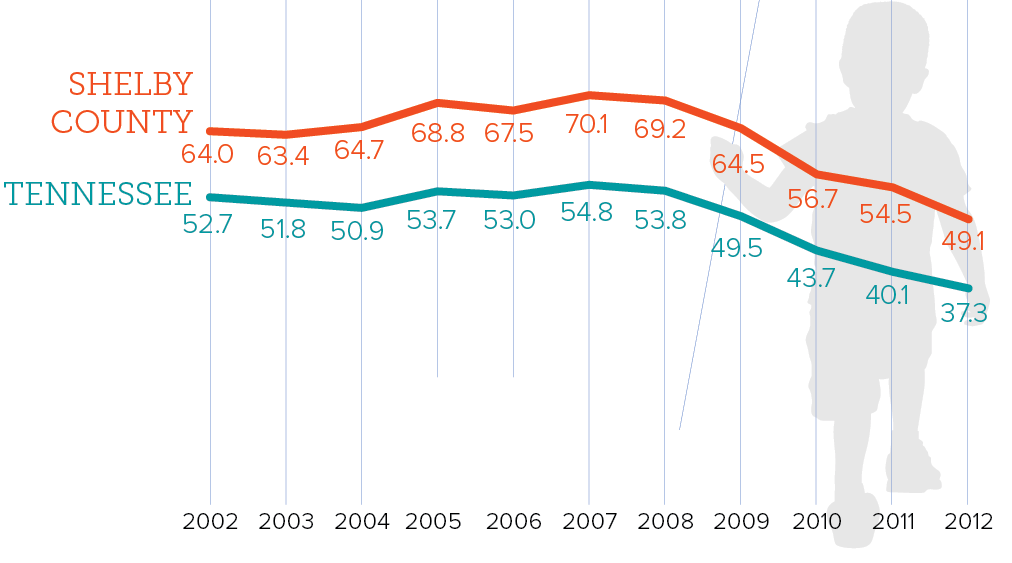
- Over the past few years, the teen birth rate has declined both in the state of Tennessee and in Shelby County, though it remains higher in Shelby County than in the state—and in the nation, where the birth rate was 29.4 in 2012 for girls between the ages of 15 and 19. (Figure 2.12).
- In 2012, 1,599 babies were born to mothers between the ages of 15 and 19 in Shelby County.
Source: Tennessee Department of Health, 2002–2012
Conclusion
Many children in Shelby County live in poverty and have mothers who are single, young, and have less than a high school education. Research suggests that these factors, along with premature births and low birth weight, place children at a greater risk for social and emotional challenges. In the next two chapters, this book takes a closer look at factors in home and in child-care settings that may affect social and emotional development among young children. Each chapter also points to meaningful opportunities to improve the lives of children in our community.
- Morse, S.B., Zheng, H., Tang, Y., & Roth, J. (2009). Early school-age outcomes of late preterm infants. Pediatrics, 123(4), e622–e629.
- Cepeda, I.L., Grunau, R.E., Weinberg, H., Herdman, A.T., Cheung, T., Liotti, M., et al. (2007). Magneto-encephalography study of brain dynamics in young children born extremely preterm. International Congress Series, 1300, 99–102.
- Figlio, D.N., Guryan, J., Karbownik, K., & Roth, J. (2013). The effects of poor neonatal health on children’s cognitive development. National Bureau of Economic Research.
- Phillips, D.A. & Shonkoff, J.P. (2000). From Neurons to Neighborhoods: The Science of Early Childhood Development. National Academies Press.
- Moore, K.A., Redd, Z., Burkhauser, M., Mbwana, K., & Collins, A. (2002) Children in poverty: Trends, consequences and policy options. Child Trends, 2009-11.
- Eamon, M.K. (2000). Structural model of the effects of poverty on externalizing and internalizing behaviors of four-tofive-year-old children. Social Work Research, 24(3), 143–154.
- Yeung, W.J., Linver, M.R., & Brooks-Gunn, J. (2002). How money matters for young children’s development: parental investment and family processes. Child Development, 73(6), 1861–1879.
- Sklar, C. (2010). Charting a new course for children in poverty: The reauthorization of the Temporary Assistance for Needy Families Program. Washington D.C.: Zero to Three.
- Davis-Kean, P.E. (2005). The influence of parent education and family income on child achievement: The indirect role of parental expectations and the home environment. Journal of Family Psychology, 19(2), 294.
- Carlson, M.J. & Corcoran, M.E. (2001). Family structure and children’s behavioral and cognitive outcomes. Journal of Marriage and Family, 63(3), 779–792.
- McLanahan, S.S. (1995). The consequences of nonmarital child-bearing for women, children, and society. Report to Congress on out-of-wedlock childbearing. Washington, D.C.: U.S. Department of Health and Human Services.
- Kaye, K. (2012). Why it matters: Teen childbearing and infant health. Washington, D.C.: The National Campaign to Prevent Teen and Unplanned Pregnancy.