Community
Community matters for children’s well-being.
Neighborhoods have important effects on parents’ ability to create a safe and healthy environment for their children. Resources like parks, playgrounds, and after-school programs help parents provide their children with enriching experiences, and social connections among adults increase parents’ sense of support and well-being. On the other hand, living in a crime-ridden, deteriorating area can undermine a family’s efforts.
The neighborhood where a child lives can have effects over and above parental income and other family-level influences. Crime, widespread unemployment, social isolation, and lack of community resources create unhealthy environments for children’s development.
Children who live in high-poverty neighborhoods face more risks than children in higher-income neighborhoods. Unfavorable neighborhood conditions can increase children’s vulnerability to adverse experiences early in life, which in turn may interfere with optimal brain development, cognitive growth, and emotional and behavioral adjustment.1
This chapter takes a look at the most recent available data on community-level factors that have been shown to affect children’s chances for later achievement and success.
FIGURE 1: Assets & Municipalities
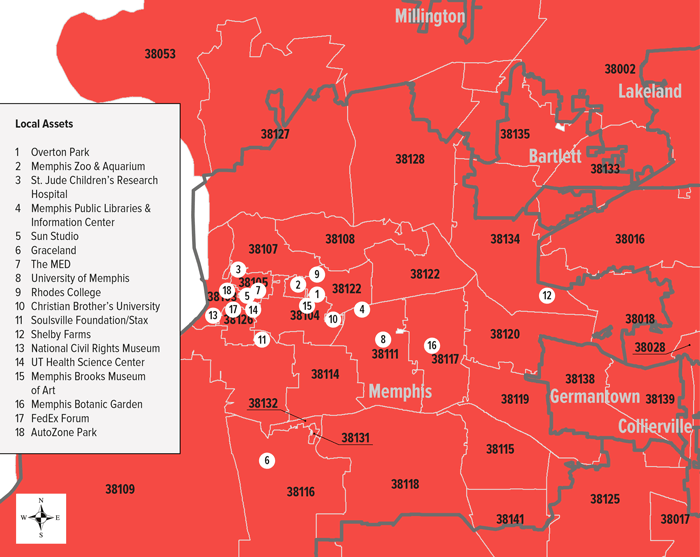
Source: Center for Community Building & Neighborhood Action, 2010
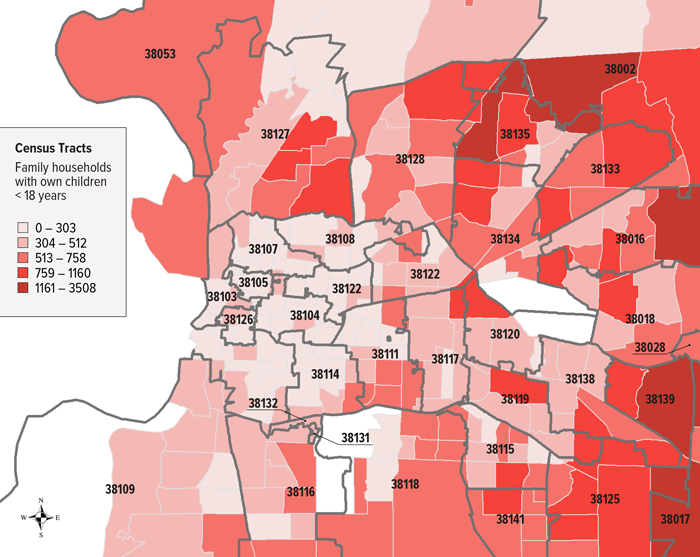
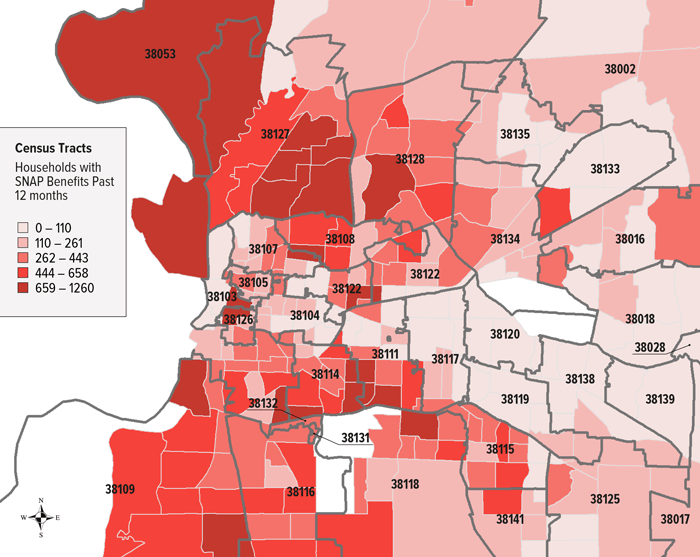
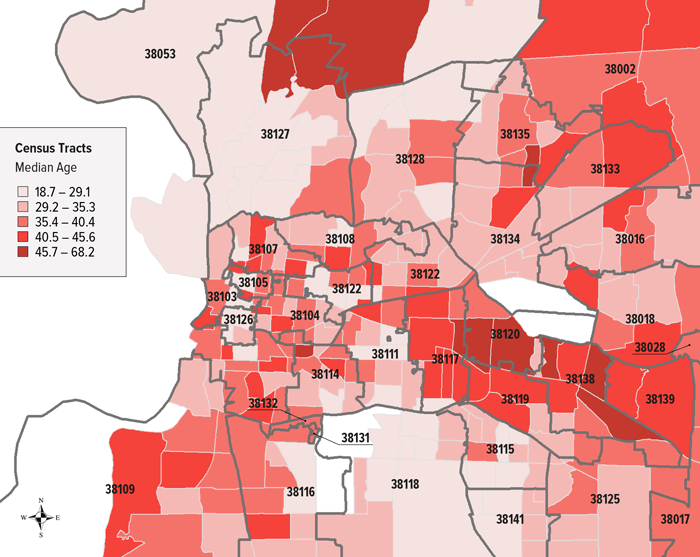
Most of the data is presented at the census-tract level. To ensure readability, we have not labeled individual census tracts in the following maps. Instead, we include zip code labels to provide a context for the tract-level statistics. Additionally, we have provided a map of well-known landmarks (FIGURE 1) to help readers orient themselves.
FIGURE 2: Median Household Income
Source: US Census Bureau, American Community Survey, 2007–2011
Neighborhood income is related to children’s outcomes.
Research consistently links income to child well-being. The effects of income begin early: by age three, lower-income children tend to have lower cognitive scores and more behavioral problems.2
But even after accounting for family income, living in a low-income neighborhood can have negative effects on children. In areas of concentrated disadvantage, children are likely to face multiple risk factors that threaten their educational, emotional, and social outcomes.3,4
On average, children from poorer neighborhoods have lower cognitive test scores than children from more affluent neighborhoods, regardless of family income.5
FIGURE 2 depicts the median household incomes for Census Tracts in Shelby County.
- Census Tracts 213.53, 215.40, 215.30 in East Shelby County have the highest median incomes—all over $100K.
- Census Tracts with the lowest incomes are 112 (with less than $10K), 45 (about $10K) and 114 (about $10K). All three are in Memphis.
Neighborhood economic hardship threatens children’s healthy development.
Economic hardship at the neighborhood level can be assessed in several ways. The most common measures are poverty, public assistance receipt, and unemployment. The following three figures use these measures to show neighborhood economic distress in Memphis and Shelby County.
Poverty
Research suggests that there is a critical threshold or “tipping point” of neighborhood poverty. When the percentage of poor families in a neighborhood reaches 20 to 30 percent, negative family and child outcomes increase sharply.6 Therefore, high-poverty neighborhoods are typically defined as having more than 30 percent of households living below the federal poverty threshold.7
Living in high-poverty neighborhoods is associated with lower-quality learning experiences in the homes of young children, even after family income is taken into account.5,8 Children in high-poverty neighborhoods are at higher risk of health problems, behavioral difficulties, teen pregnancy, high school dropout, and substance abuse, even after accounting for family characteristics.6
As early as age 3, children are being affected by neighborhood characteristics.5 Neighborhood income has been linked to important aspects of young children’s home environments, including safety, maternal warmth, and learning stimulation.9
FIGURE 3 shows each Census Tract’s percentage of families with incomes below the poverty line.
- Census Tracts 45, 114, 112 have the highest percentages in Shelby County.
- In Census Tract 45, 73% of families are living in poverty.
Public Assistance
Further evidence of the economic distress experienced by many Shelby County neighborhoods is presented in FIGURE 4, which shows the number of families receiving public assistance through the Supplemental Nutrition Assistance Program (SNAP).
- Census Tracts with the highest number are 88, 99.01, 223.22.
- Census Tracts with the lowest numbers are 85 (downtown Memphis) and 214.20 and 43 (along the Poplar corridor).
FIGURE 3: Percent of Families Living Below the Poverty Line
Source: US Census Bureau, American Community Survey, 2007–2011
FIGURE 4: Number of Households Receiving SNAP
Source: US Census Bureau, American Community Survey, 2007–2011
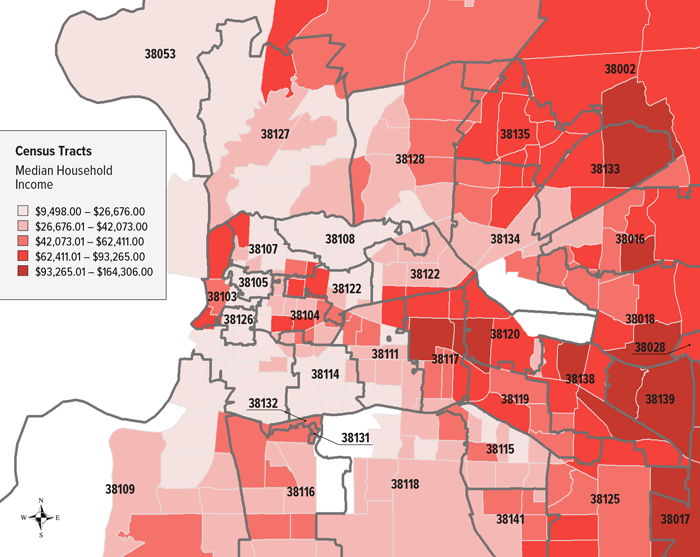
FIGURE 5: Number Civilian Labor Force Unemployed
Source: US Census Bureau, American Community Survey, 2007–2011
Unemployment
Widespread unemployment creates an unfavorable environment for children. Neighborhood unemployment has been linked to negative birth outcomes like prematurity10 and to long-term outcomes including high school graduation, teen non-marital childbearing and employment.11,12
FIGURE 5 shows Census Tract patterns of unemployment in Shelby County. (Our measure of unemployment is based on census estimates of individuals who were not working but were able, available, and actively looking for work.)
- Census Tracts with the highest number of unemployed adults are 78.21, 100, and 67, with 700 or more.
- Census Tracts with the lowest numbers are 211.13 and 43 (downtown Memphis) with around 20.
FIGURE 6: Percent of Families Below Poverty & Food Deserts
Source: US Census Bureau, American Community 38017 Survey, 2007–2011; US Department of Agriculture, Economic Research Services, 2013
Many families lack convenient access to healthy food.
A “food desert” is an area without a convenient source of healthy food. Specifically, the U.S. Department of Agriculture (USDA) defines a food desert as a census tract where a substantial number of residents have low access to a supermarket or large grocery store.13 Instead, the chief sources of food for the neighborhood are fast food chains and convenience stores.
A proper balance of nutrients during early childhood is critical for normal brain development. Malnutrition in infancy and early childhood is a key risk factor for cognitive deficits, lower academic achievement, and behavior problems. Because of the rapid pace and lifelong effects of brain development in a child’s first three years, even mild or temporary nutritional deficits can have serious and sometimes irreversible consequences.14,15
FIGURE 6 shows the prevalence of food deserts in Shelby County. Census Tracts outlined in blue are classified as food deserts by the USDA.
- Memphis has an alarming number of food deserts, including Census Tracts in North Memphis, Frayser, Whitehaven, Downtown, and other areas.
- Food deserts are likely to be found in high poverty areas. For example, Census Tracts 103, 5, 68 have high poverty percentages and are also classified as USDA Food Deserts.
FIGURE 7: Percent of Total Population 5 years & Under
Source: US Census Bureau, American Community Survey, 2007–2011
Too many of Shelby County’s youngest children are at risk.
The statistics presented in this chapter have troubling implications for the well-being of Shelby County’s young children. The prevalence of neighborhood risk factors means that children can be at risk even as their families struggle to provide a nurturing and stimulating home environment.
Early disadvantage is especially detrimental to children’s development. For example, income and economic circumstances appear to have stronger effects in early childhood than in adolescence.16
FIGURE 7 shows the population of children under age 5 in Shelby County. Comparing this pattern to those of the maps above reveals that a disproportionate number of our community’s children live in high-risk neighborhoods.
- Census Tracts 206.44 and 206.21 (both in North Memphis) and 213.52 (in East Shelby County) have the highest numbers of children age 5 and younger.
- Census Tracts 42 and 43 (both in downtown Memphis) have the lowest numbers.
Community-level policies are necessary to promote positive outcomes for Shelby County’s children.
Neighborhoods matter for children’s well-being. Experts are becoming increasingly aware that efforts to promote children’s well-being must include community-level initiatives. Targeted, substantial investments in neighborhood resources are a key component in reducing poverty and fostering human capital.17
This is especially true for Shelby County, where residential patterns have changed in recent years. The population of Memphis’ central areas is decreasing, while outlying areas of Shelby County are gaining population. In order to combat neighborhood-level risk for Shelby County’s children, we need a more thorough understanding of these trends and the ways they will affect our community’s future.
- Leventhal T, Brooks-Gunn J. The neighborhoods they live in: The effects of neighborhood residence upon child and adolescent outcomes. Psychological Bulletin. 2000; 126:309–337.
- Berger LM, Paxson C, Waldfogel J. Income and child development. Children and Youth Services Review. 2009; 31(9):978–989.
- Fantuzzo J, Fuscoy R. Children’s direct exposure to types of domestic violence crime: a population-based investigation. Journal of Family Violence. 2007; 22(7):543–552.
- Sampson RJ, Morenoff JD, Gannon-Rowley T. Assessing “neighborhood effects”: Social processes and new directions in research. Annual Review of Sociology. 2002; 28:443–478.
- Klebanov PK, Brooks-Gunn J, McCarton C, McCormick MC.The contribution of neighborhood and family income to developmental test scores over the first three years of life. Child Development. 1998; 69(5):1420–36.
- Mather M, Rivers KL. The concentration of negative child outcomes in low-income neighborhoods. 2006. Annie E. Casey Foundation. Available at: http://www.aecf.org/upload/publicationfiles/census.pdf.
- Leventhal T, Brooks-Gunn J. Changes in neighborhood poverty From 1990 to 2000 and youth’s problem behaviors. Developmental Psychology. 2011; 47(6):1680–98.
- Callahan KL, Scaramella LV, Laird RD, et al. Neighborhood disadvantage as a moderator of the association between harsh parenting and toddler-aged children’s internalizing and externalizing problems. Journal of Family Psychology. 2011; 25(1):68–76.
- Klebanov PK, Brooks-Gunn J, Duncan GJ. Does neighborhood and family poverty affect mother’s parenting, mental health and social support? Journal of Marriage and Family. 1994; 56(2):441–55.
- Messer LC, Vinikoor LC, Laraia BA, et al. Socioeconomic domains and associations with preterm birth. Social Science and Medicine. 2008; 67(8):1247–1257.
- Galster G, Marcotte DE, Mandell M, et al. The influence of neighborhood poverty during childhood on fertility, education, and earnings outcomes. Housing Studies. 2007; 22(5):723–751.
- Haveman R, Wolfe B. The determinants of children’s attainments: A review of methods and findings. Journal of Economic Literature. 1995; 33:1829–1878.
- United States Department of Agriculture, Economic Research Service. Access to Affordable and Nutritious Food: Measuring and Understanding Food Deserts and Their Consequences. 2009. Available at: http://www.ers.usda.gov/media/242675/ap036_1_.pdf.
- Georgieff MK. Nutrition and the developing brain: nutrient priorities and measurement. American Journal of Clinical Nutrition. 2007; 85:614S–620S.
- Wachs TD. Multiple influences on children’s nutritional deficiencies: a systems perspective. Physiology and Behavior. 2008; 94:48–60.
- Duncan G, Ziol-Guest K, Kalil A. Early childhood poverty and adult attainment, behavior, and health. Child Development. 2010; 81(1):306–325.
- Bryant R. Children, families and poverty: Definitions, trends, emerging science and implications for policy. Social Policy Report. 2012; 26(3):20–21.
