Health
The health and well-being of our children determine the future of our community.
Improving the well-being of mothers, infants and children is an essential public health goal for Shelby County.
This section of the Data Book examines some of the most common problems that jeopardize the health of our mothers, infants and children. It aim to provide community partners and public officials with the information they need to promote policy development and to assure quality service delivery in Shelby County.
This year’s health chapter shows that some Shelby County health measures have improved, while others have worsened. For example, infant mortality has declined, and fewer mothers report receiving no prenatal care. On the other hand, low birth weight remains essentially unchanged, and racial disparities persist for most health indicators.
Birth outcomes are a key measure of community health.
The Healthy People 2020 objectives identify infant mortality and preterm births as leading health indicators for maternal, infant and child health in the United States.1
These are defined as:
- infant death: death during the first year after birth
- premature birth: birth before 37 weeks gestation In 2011:
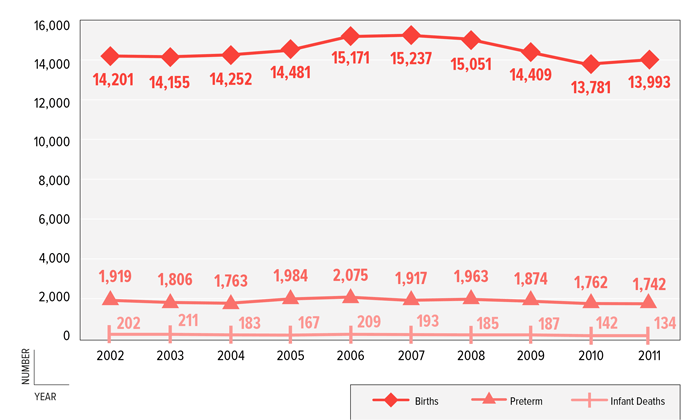
- 13,993 babies were born.
- 134 died during infancy.
- 1,742 were born prematurely.
The raw numbers tell only part of the story. For a better understanding, we need to examine the infant mortality rate, as well as the percentage of preterm babies, which are presented in FIGURES 2 and 3.
FIGURE 1: Number of Total Live Births, Preterm Births & Infant Deaths, Shelby County, 2002–2011
FIGURE 1 shows Shelby County’s total number of births, infant deaths, and premature births.
Source: Tennessee Department of Health, 2002–201131
The infant mortality rate has declined by approximately 25 percent during the past two years.
The measure of infant deaths is typically reported as the infant mortality rate—the number of infant deaths per 1,000 live births. This measure is widely used across the world as an overall indicator of community health status.
Infant mortality can be divided into two categories:
- Neonatal mortality (death before 28 days) is typically associated with short gestation, low birth weight, pregnancy complications and congenital malformations.
- Post-neonatal mortality (death between 28 days and 1 year) is associated with Sudden Infant Death Syndrome (SIDS), congenital malformations, and unintentional injuries.2
In Shelby County:
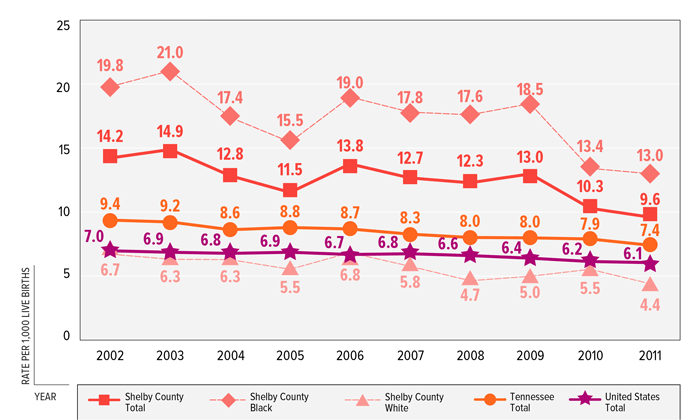
- The infant mortality rate declined between 2009 and 2011, from 13 to 9.6 infant deaths per 1,000 live births.
- Still,it remains higher than the national rate (6.1 per 1,000 live births) and the Healthy People 2020 goal of 6 deaths per 1,000 live births (FiGurE 2).
- Approximately 45 percent of all infant deaths among babies born in 2010 were attributed to preterm-related causes.3
While racial disparities in infant mortality are related to several risk factors, such as preterm and low birth weight delivery, socioeconomic status and access to medical care, these differences only partially explain the observed disparities.4
In Shelby County:
- The infant mortality rate among infants born to black women decreased by almost 30 percent (18.5 to 13 deaths per 1,000 live births) between 2009 and 2011.
- However, the rate remains almost triple that of infants born to white women (FIGURE 2).
FIGURE 2: Infant Mortality Rate per 1,000 Live Births by Race, Shelby County, Tennessee & United States, 2002–2011
FIGURE 2 highlights the decline in infant mortality in Shelby County between 2009 and 2011.
Source: Tennessee Department of Health, 2002–201131, National Center for Health Statistics, 200932, National Center for Health Statistics, 201133
Twelve percent of all infants were born preterm during 2011.
Babies born prematurely (before 37 weeks gestation) are at increased risk for health complications and death. Complications arising during infancy can include respiratory distress, jaundice and anemia. Longer term complications can include learning and behavioral problems, cerebral palsy, lung problems and vision and hearing loss.4 In 40 percent of the more than half a million babies born prematurely each year in the United States, the cause is unknown.5 Induced preterm births are typically medically indicated due to preeclampsia or intrauterine growth restriction, whereas spontaneous preterm births can result from multiple causes, including vascular disease, infection or inflammation.6
Premature birth remains a leading cause of infant death in the United States, but nationally, the percentage of preterm births declined between 2005 and 2011.4
In Shelby County:
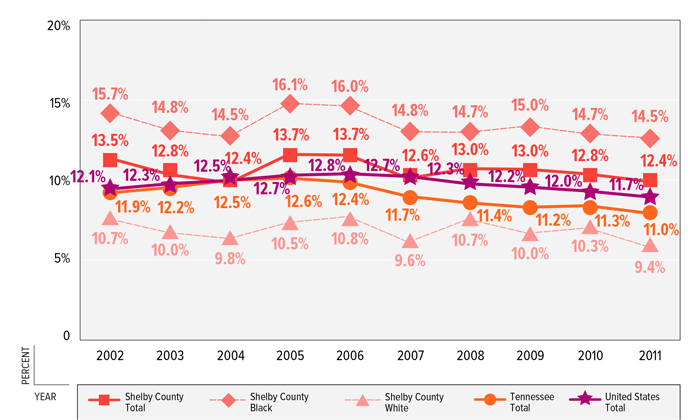
- The percentage of preterm births (12.4 percent in 2011) has not significantly declined over the past two years and remains slightly higher than the national percentage (11.7 percent) and Healthy People 2020 Goal of 11.4 percent (FIGURE 3).
- In 2011, 8.6 percent of babies were born “late preterm” (34 to 36 weeks’ gestation), 1.5 percent at 32–33 weeks, and 2.3 percent were “very preterm” (less than 32 weeks).
- Nationally, non-Hispanic black women have the highest rates of preterm birth.4 Racial disparities among preterm births are also apparent in Shelby County:
- In 2011, 14.5 percent of babies born to black women were born preterm, compared to 9.4 percent of babies born to white women.
- This racial gap has remained relatively unchanged over the past ten years, with black women consistently reporting a higher percentage of preterm births than white women (FIGURE 3).
FIGURE 3: Percent of Preterm Babies by Race, Shelby County, Tennessee & United States, 2002–2011
As FIGURE 3 shows, preterm births in Shelby County have not significantly declined in recent years.
Source: Tennessee Department of Health, 2002–201131, National Center for Health Statistics, 200934, National Center for Health Statistics, 201135
The percentage of low birth weight babies has remained unchanged over the past ten years.
Infants born at low birth weight (less than 2,500 grams or 5.5 pounds) are at a greater risk for physical and developmental health problems and death within the first year of life compared to infants of normal birth weight. Low birth weight is often a result of premature birth, but it can also occur in full term babies affected by fetal growth restriction related to factors such as maternal hypertension, tobacco smoke exposure or inadequate weight gain during pregnancy.7
In Shelby County:
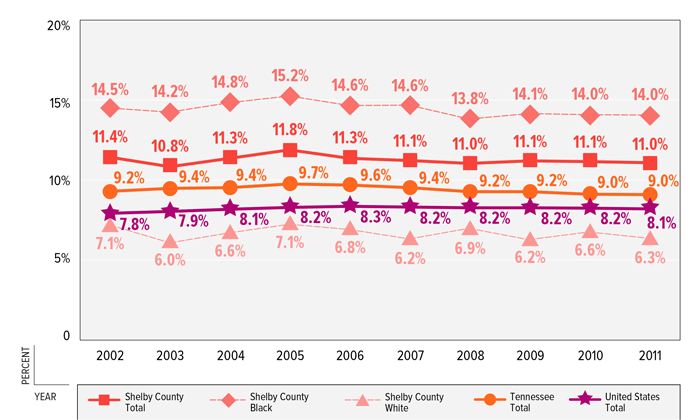
- The percentage of low birth weight babies during 2011 (11 percent) remains above national figures (8.1 percent) and the Healthy People 2020 goal of 7.8 percent (FIGURE 4).
- 18.8 percent of all low birth weight births were very low birth weight (<1,500 grams) in 2011.
Nationally, infants born to non-Hispanic black women have low birth weight rates almost two times greater than infants born to non-Hispanic white women.* Provided the increased risk for death, this racial disparity in low birth weight contributes to the infant mortality gap between non- Hispanic black and white infants.4
- Racial disparities among low birth weight babies are also apparent in Shelby County:
- In 2011, the percentage of low birth weight babies born to black women (14 percent) was more than twice the percentage born to white women (6.3 percent).
- This racial gap has remained relatively unchanged over the past ten years, with black women consistently reporting a higher percentage of low birth weight births than white women (FIGURE 4).
*Please note that for US - NCHS report is broken down by non-Hispanic black and non-Hispanic white.
FIGURE 4: Percent of Low Birth Weight Babies by Race, Shelby County, Tennessee & United States, 2002–2011
FIGURE 4 highlights the racial disparities in low birth weight in Shelby County.
Source: Tennessee Department of Health, 2002–201031, National Center for Health Statistics, 200934, National Center for Health Statistics, 201135
Teenage pregnancies have declined in recent years.
Teen pregnancy and childbearing can have substantial long-term effects on children, such as poor academic achievement, incarceration, and unemployment as an adult.8 The teen birth rate is expressed as the number of births per 1,000 females aged 15–19. Nationally, the birth rate among adolescent females in 2011 decreased to the lowest rate ever recorded
(31.3 per 1,000). This decline is attributed to delays in age first intercourse and increased use of contraceptive methods.4
In Shelby County:
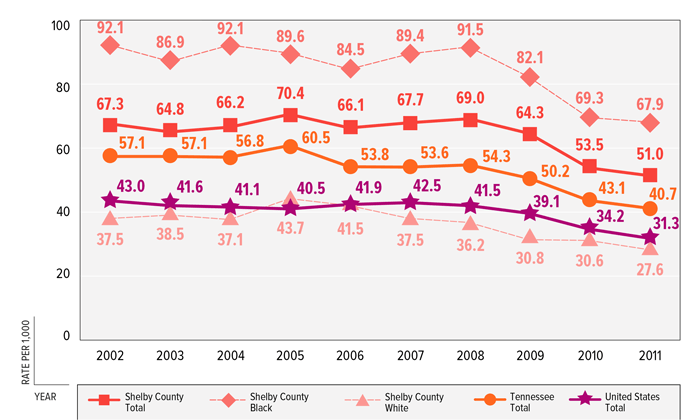
- 1,802 infants (13 percent of all births) were born to teenagers (age 15–19), for a teen birth rate of 51 per 1,000 teens during 2011.
- The teen birth rate has declined by 26 percent since 2008 but remains above the national rate in 2011 (31.3 per 1,000).
- Substantial racial disparities persist in teen birth rates: black teens have a birth rate over twice the rate among white teens (FIGURE 5).
Adolescent abortion trends are also important measures to monitor progress in reducing pregnancies among females 15–19 years;9 the rate of induced termination of pregnancy is expressed as the number of abortions per 1,000 females.
In Shelby County:
- During 2010, 4,551 induced terminations were reported, and approximately 14 percent (n=618) occurred among teens aged 15–19 years (not shown).10
- From 2008–2010, the rate of induced termination of pregnancy among females 15–17 and 18–19 years declined by 24 percent and 28 percent, respectively (not shown).10
FIGURE 5: Birth Rate per 1,000 Females Age 15–19 Years by Race, Shelby County, Tennessee & United States, 2002–2011
FIGURE 5 highlights the fact that teen birth rates continue to decline in Shelby County.
Source: Tennessee Department of Health, 2002–201131; National Center for Health Statistics, 200934, National Center for Health Statistics, 201135, American Community Survey, 2002–2009, 201136, United States Decennial Census, 201037
STD rates among adolescent females indicate the risk for unintended pregnancy.
Rates of sexually transmitted diseases (STDs) can indicate the presence of risky sexual behaviors and consequently unintended pregnancy among adolescents.
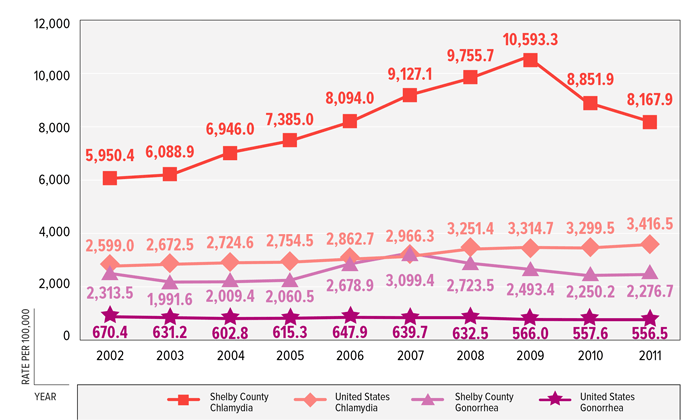
Trends in adolescent female STD rates are shown in FiGurE 6:
- The Chlamydia rate among females aged 15–19 years in Shelby County peaked in 2009 and has since declined by 23 percent. The national Chlamydia rate among females 15–19 years has not shown the same declining trend; however, the rate
- The Gonorrhea rate among females aged 15–19 years in Shelby County showed a consistent decline by 27 percent between 2007 and 2010 but still remains over four times greater than the national female Gonorrhea rate in 2011.
among Shelby County females remains 3.5 times higher than the national rate in 2011.
The Youth Risk Behavior Survey, a national-based survey implemented by the Centers for Disease Control and Prevention, has been administered bi- annually by Memphis City Schools since 2003.
According to the high school survey results:
- In 2011, 37 percent of female survey participants reported having sex with at least one person in the past three months; this finding is significantly lower than 2005 (44.2 percent) (not shown).11
- Since 2007, the percentage of females not using birth control pills has declined (from 91.4 percent to 86.7 percent), and the percentage of females not using a condom during last sexual intercourse has increased (from 30.8 percent to 34.8 percent), but these changes are not statistically significant (not shown).11
FIGURE 6: Chlamydia & Gonorrhea Rate per 100,000 among Females Age 15–19 Years, Shelby County & United States, 2002–2011
FIGURE 6 shows that the rates of Chlamydia and Gonorrhea among teen girls in Shelby County have declined, but still remain higher than national rates.
Source: American Community Survey, 2002–2009, 201136, United States Decennial Census, 201037, Tennessee Department of Health, Office of Policy, 2002–201138, Centers for Disease Control and Prevention, 2002–201139
Reduction of perinatal HIV and congenital syphilis are key targets to promote maternal and child health outcomes.
Prevention of perinatally acquired HIV and congenital syphilis infections are two objectives represented among the Healthy People 2020 Goals.1 Mother-to-child transmission of HIV can occur during pregnancy, labor, delivery or breastfeeding. Since the mid-1990s, HIV testing and preventive interventions have resulted in more than a 90 percent decline in the number of children acquiring perinatal HIV in the United States.12 In Shelby County, the number of perinatal infections peaked at 10 cases during 1999. Since then, less than five cases have been diagnosed each year, and zero infections were identified during 2011. Observed racial disparities in access to prenatal care are also reflected in the burden of perinatal HIV; since 2000, more than 90 percent of newly diagnosed infections have been among non-Hispanic black infants (not shown).13
Syphilis can also be transmitted to a baby during pregnancy. National trends in female primary and secondary syphilis are usually followed by similar patterns in the incidence of congenital syphilis.14 This trend is also observed in Shelby County during the past two decades. As the number of female primary and secondary syphilis cases has declined by over 90 percent between 1992 and 2011, the number of congenital syphilis cases has also declined by over 80 percent during this same time period. Despite these reductions, the congenital syphilis rate during 2011 (50 per 100,000 live births) was more than five times higher than the Healthy People 2020 objective (9.1 per 100,000 live births) (not shown).15
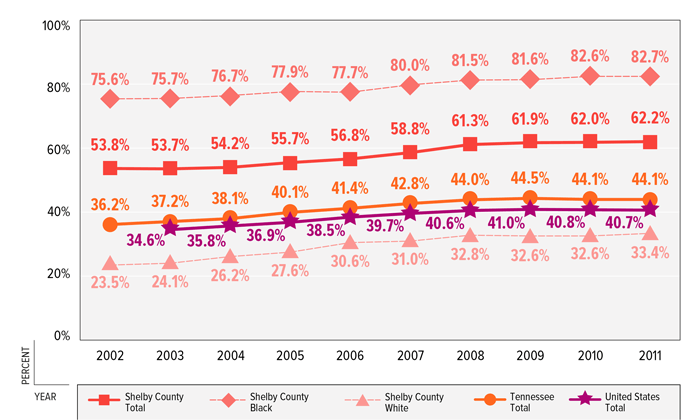
FIGURE 7: Percent of Births to Unmarried Parents by Race, Shelby County, Tennessee & United States, 2002–2011
FIGURE 7 highlights the persistent racial disparities among births to unmarried mothers in Shelby County.
Source: Tennessee Department of Health, 2002–201131, National Center for Health Statistics, 201135, CDC Wonder, 2003–200940
Births to unmarried mothers continue to increase.
Children of unmarried mothers are at higher risk for adverse birth outcomes than children born to married women.16,17 In addition, children born to single-mothers tend to have fewer social and financial resources and more academic, emotional and behavioral problems.18,19 In Tennessee, infants born to unmarried mothers have an infant mortality rate that is up to twice that of infants born to married mothers.20
In Shelby County:
- The percentage of births to unmarried mothers has increased from 53.8 percent in 2002 to 62.2 percent in 2011 (FIGURE 7).
- Racial disparities among births to unmarried mothers are apparent; 82.7 percent of births among black women were to unmarried women, compared to 33.4 percent among white women in Shelby County. (FIGURE 7).
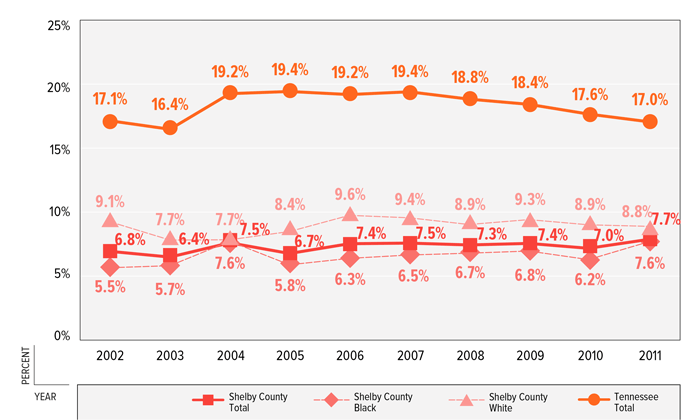
FIGURE 8: Percent of Mothers Who Reported Smoking During Pregnancy by Race, Shelby County & Tennessee, 2002–2011
FIGURE 8 indicates that prenatal smoking continues to be less common in Shelby County than across Tennessee.
Source: Tennessee Department of Health, 2002–201131
Smoking during pregnancy remains low.
Smoking during pregnancy is associated with increased risk for preterm delivery, low birth weight, and perinatal mortality, including stillbirths, neonatal deaths, and sudden infant death syndrome (SIDS).21 Additionally, women who smoke are less likely to breastfeed their infants than women who do not smoke.22
In Tennessee, the infant mortality rate among mothers who smoked during pregnancy is higher than that of non-smoking mothers (13.4 vs. 7.7 per 1,000 births).20
FIGURE 8 indicates that prenatal smoking continues to be less common in Shelby County than across Tennessee:
- Statewide, the percentage of mothers who smoked during pregnancy (17 percent) was more than twice the percentage for Shelby County (7.7 percent).
- The trend in prenatal smoking among Shelby County mothers has remained relatively stable around 7 percent in the past six years, but increased from 7 percent in 2010 to 7.7 percent in 2011.
- Smoking during pregnancy is consistently higher among white mothers than black mothers in Shelby County; however, the percent of black mothers smoking during pregnancy increased in 2011 (from 6.2 percent in 2010 to 7.6 percent in 2011) while the percent of white mothers smoking during pregnancy remained stable.
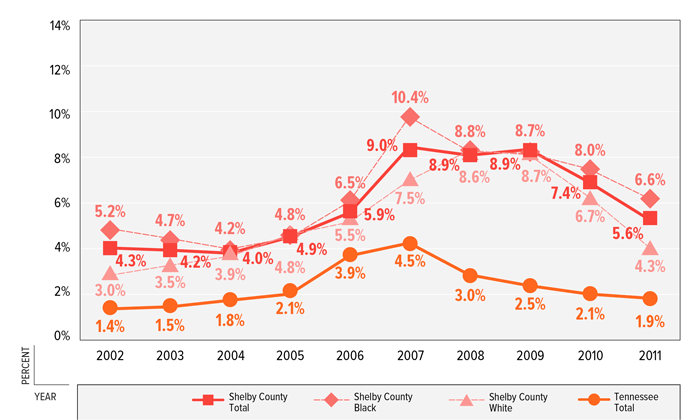
FIGURE 9: Percent of Mothers Who Report Having Received No Prenatal Care, Shelby County & Tennessee, 2001–2011
FIGURE 9 illustrates the continuing decline in the percentages of Shelby County and Tennessee mothers who received no prenatal care.
Source: Tennessee Department of Health, 2001–201131
The percentage of mothers receiving no prenatal care continues to decline.
Poor use of prenatal care has been associated with increased risk for premature and low birth weight births, infant mortality and maternal mortality.23
FIGURE 9 presents yearly percentages of mothers who had no prenatal care documented on the infants’ birth certificate:
- In 2011, 5.6 percent of Shelby County mothers had no prenatal care, down from 8.9 percent in 2009.
- The percentage of black mothers and white mothers not receiving prenatal care also declined from 2009–2011, but the lack of prenatal care remains higher among black mothers (6.6 percent) than white mothers (4.3 percent).
- As in previous years, the percentage of women not receiving prenatal care is higher in Shelby County than across the state (5.6 percent vs. 1.9 percent).
There are often socio-demographic barriers to accessing prenatal care, including poverty, adolescent age, non-English speaking, being unmarried, and having less than a high school education.23 Nationally, 2.5 percent of mothers with a bachelors degree received late or no prenatal care, compared to 11.6 percent of mothers who had less than a high school diploma.4 This disparity is also apparent in Shelby County.
Among women who had no prenatal care in 2011:
- 54.8 percent had less than a high school diploma, which is higher than the percentage of women who did receive prenatal care and had less than a high school diploma (22.2 percent) (not shown).
- 17.3 percent were less than 20 years of age, which is higher than the percentage of women less than 20 years of age who did receive prenatal care (12.9 percent) (not shown).
- 85.8 percent were unmarried, which is higher than the percentage of unmarried women who did receive prenatal care (60.8 percent) (not shown).
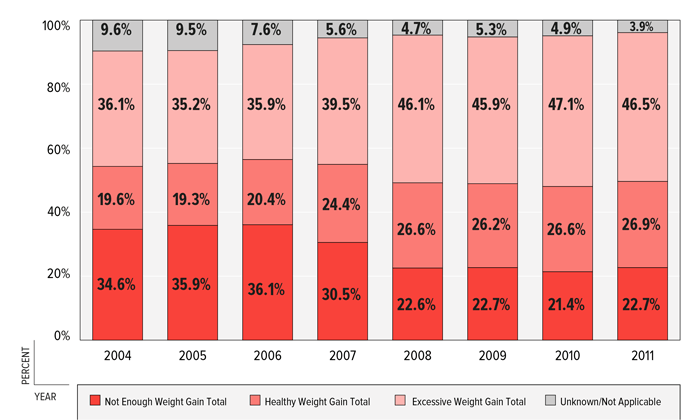
FIGURE 10: Percent of Mothers by Pregnancy Weight Gain Status, Shelby County, 2004–2011
FIGURE 10 highlights the prevalence of insufficient and excessive weight gain during pregnancy among Shelby County mothers.
Source: Tennessee Department of Health, 2004–201131
Excessive weight gain during pregnancy is a pertinent health risk for mothers and infants.
Obesity among American women of childbearing age has more than doubled since the 1970s.24 In the United States, more than half of pregnant women are overweight or obese, putting them at risk for pregnancy complications such as gestational diabetes, hypertension, preeclampsia, cesarean delivery, and postpartum weight retention.25
Excess gestational weight gain is also associated with maternal and child health outcomes, including preterm and low birth weight births, large-for-gestational-age infants, and cesarean delivery.26
FIGURE 10 shows patterns of pregnancy weight gain among Shelby County mothers from 2004 through 2011, based on Institute of Medicine recommendations.24
In 2011:
- 46.5 percent of pregnant mothers experienced excessive weight gain.
- Almost 23 percent did not gain enough weight.
- About 27 percent had shown healthy weight gain.
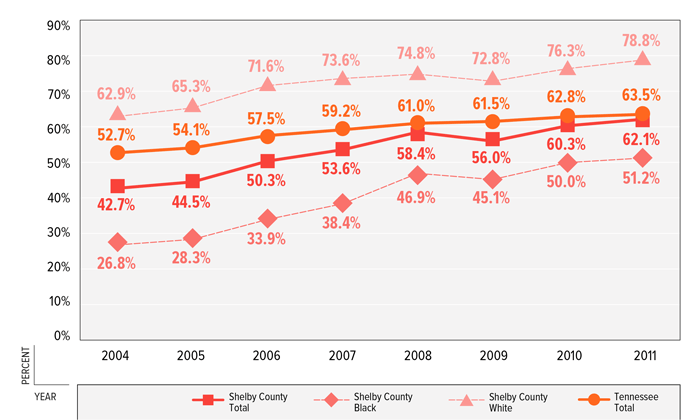
FIGURE 11: Percent of Mothers Who Initiated Breastfeeding, Shelby County & Tennessee, 2004–2011
FIGURE 11 highlights the substantial increase from 2004 to 2011 in the percentage of new mothers in Shelby County who initiate breastfeeding.
Source: Tennessee Department of Health, 2004–201131
Initiation of breastfeeding is increasing.
Breast milk is the most appropriate source of nutrition for infants, and it provides vital health benefits to both the infant and mother. The American Academy of Pediatrics (AAP) recommends exclusive breastfeeding during a baby’s first six months and continued breastfeeding for at least the first year.27 Infants who are not breastfed are more likely to suffer poor health outcomes, including infections, asthma, diabetes, obesity, leukemia and sudden infant death syndrome. Benefits for mothers include reduced risk of breast cancer, ovarian cancer, diabetes, and postpartum depression.28,29
In 2009, national survey data shows that 77 percent of new mothers initiated breastfeeding, but only 48 percent were breastfeeding 6 months later, and this declined to 26 percent by 12 months. Additionally, only 16 percent of new mothers followed the AAP recommendation to exclusively breastfeed (give only breast milk) for babies younger than 6 months.30
Breastfeeding statistics for Shelby County are collected from birth certificate forms, which include information on whether new mothers have begun breastfeeding by the time they leave the hospital.
FIGURE 11 indicates:
- Mothers who initiated breastfeeding in Shelby County increased from 42.7 percent in 2004 to 62.1 percent in 2011.
- The percentage of mothers who initiated breastfeeding in Shelby County (62.1 percent) was slightly lower than Tennessee (63.5 percent) during 2011.
- Initiation of breastfeeding is consistently higher among white mothers than black mothers in Shelby County, where 78.8 percent of white mothers initiated breastfeeding in 2011 compared to 51.2 percent of black mothers.
- United States Department of Health and Human Services. Healthy People 2020 Objectives. Retrieved from: http://www.healthypeople.gov/2020. Accessed February 25, 2012.
- CDC. Quick Stats: Leading Causes of Neonatal and Postneonatal Deaths — United States, 2002. MMWR. 2005; 54(38):966.
- Tennessee Department of Health, Division of Policy, Planning and Assessment Health Statistics, Linked Birth and Infant Death Files, 2010.
- United States Department of Health and Human Services, Health Resources and Services Administration, Maternal and Child Health Bureau. Child Health USA 2012. Retrieved from: http://mchb.hrsa.gov/publications/pdfs/chusa2012.pdf. Accessed February 25, 2013.
- March of Dimes. Prematurity Research. Retrieved from: http://www.marchofdimes.com/research/prematurityresearch.html. Accessed February 26, 2013.
- Goldenberg RL, Culhane JF, Iams JD, Romero R. Epidemiology and causes of preterm birth. Lancet. 2008 Jan 5; 371(9606):75–84.
- March of Dimes. Low Birthweight. Retrieved from: http://www.marchofdimes.com/baby/premature_lowbirthweight.html. Accessed: February 25, 2013.
- Hoffman SD. Kids Having Kids: Economic Costs and Social Consequences of Teen Pregnancy. Washington, DC: The Urban Institute Press; 2008. Retrieved from: http://www.urban.org/publications/901199.html. Accessed March 20, 2012.
- CDC. Abortion surveillance—United States, 2009. MMWR 2012;61(No. SS–08).
- Tennessee Department of Health, Division of Policy, Planning and Assessment Health Statistics. Induced Termination of Pregnancy, 2008–2010. Retrieved from: http://health.state.tn.us/Statistics/vital.htm. Accessed February 25, 2013.
- CDC. 1991–2011 High School Youth Risk Behavior Survey Data. Retrieved from: http://apps.nccd.cdc.gov/youthonline. Accessed February 25, 2013.
- CDC. Fact Sheet: HIV among Pregnant Women, Infants and Children in the United States. Retrieved from: http://www.cdc.gov/hiv/topics/perinatal/index.htm. Accessed March 4, 2013.
- Tennessee Department of Health, Division of Policy, Planning and Assessment Health Statistics, Enhanced HIV/AIDS Reporting System, 1993–2011.
- CDC. Congenital Syphilis – United States, 2003–2008. MMWR 2010; 59 (14), 413–17.
- Tennessee Department of Health, Division of Policy, Planning and Assessment Health Statistics, Sexually Transmitted Disease Data, 1992–2011.
- Ventura SJ, Bachrach CA. Nonmarital childbearing in the United States, 1940–99. Natl Vital Stat Rep. 2000; 48 (16). Hyattsville, MD: National Center for Health Statistics.
- Mathews TJ, MacDorman MF. Infant mortality Statistics from the 2005 period linked birth/infant death data set. Natl Vital Stat Rep. 2008; 57(2). Hyattsville, MD: National Center for Health Statistics.
- McLanahan S. The consequences of nonmarital childbearing for women, children, and society. Report to Congress on Out-of-Wedlock Childbearing; 1995. Hyattsville, MD: National Center for Health Statistics.
- Carlson MJ, Corcoran ME. Family structure and children’s behavioral and cognitive outcomes. Journal of Marriage and Family. 2001;63(3):779–792.
- Bauer AM, Li Y, Law DJ. Infant Mortality in Tennessee, 1997–2006. Tennessee Department of Health Office of Policy, Planning and Assessment.
- CDC. Smoking During Pregnancy. Retrieved from: http://www.cdc.gov/tobacco/basic_information/health_effects/pregnancy/. Accessed March 29, 2012.
- United States Department of Health and Human Services. Preventing Tobacco Use Among Youth and Young Adults: A Report of the Surgeon General. Atlanta, GA: United States Department of Health and Human Services, Centers for Disease Control and Prevention, National Center for Chronic Disease Prevention and Health Promotion, Office on Smoking and Health, 2012.
- Kiely JL, Kogan MD. Prenatal Care. In: Wilcox LS, Marks JS, editors. From Data to Action: Centers for Disease Control’s Public Health Surveillance for Women, Infants and Children. Washington(DC): United States Department of Health and Human Services; 1994.
- Institute of Medicine and National Research Council Committee to Reexamine IOM Pregnancy Weight Guidelines. Weight Gain During Pregnancy: Reexamining the Guidelines. Washington (DC): National Academies Press (US); 2009.
- American College of Obstetricians and Gynecologist. Obesity in pregnancy. Committee Opinion No. 549. Obstet Gynecol. 2013; 121:213–7.
- Viswanathan M, Siega-Riz AM, Moos M-K, Deierlein A, Mumford S, Knaack J, Thieda P, Lux LJ, Lohr KN. Outcomes of Maternal Weight Gain, Evidence Report/ Technology Assessment No. 168. (Prepared by RTI International-University of North Carolina Evidence-based Practice Center under Contract No. 290-02-0016.) AHRQ Publication No. 08-E009. Rockville, MD: Agency for Healthcare Research and Quality. May 2008.
- American Academy of Pediatrics. Policy Statement: Breastfeeding and the Use of Human Milk. Pediatrics. 2012; 129(3):827–841.
- United States Department of Health and Human Services. The Surgeon General’s Call to Action to Support Breastfeeding. Washington, DC: United States Department of Health and Human Services, Office of the Surgeon General; 2011.
- United States Department of Health and Human Services, Office on Women’s Health. Frequently asked questions – Breastfeeding. Retrieved from: http://www.womenshealth.gov/publications/our-publications/fact-sheet/Breastfeeding.pdf. Accessed April 11, 2012.
- CDC. Breastfeeding Among United States Children Born 2000—2009, CDC National Immunization Survey. Retrieved from: http://www.cdc.gov/breastfeeding/data/NIS_data/index.htm. Accessed February 26, 2013.
- Tennessee Department of Health, Office of Policy, Planning and Assessment, Division of Health Statistics, Death Record Data 2002–2011.
- National Center for Health Statistics, National Vital Statistics Reports, Volume 60, Number 3, Deaths: Final Data for 2009, http://www.cdc.gov/nchs/data/nvsr/nvsr60/nvsr60_03.pdf.
- National Center for Health Statistics, National Vital Statistics Reports, Volume 61, Number 6, Deaths; Preliminary data for 2011, http://www.cdc.gov/nchs/data/nvsr/nvsr61/nvsr61_06.pdf.
- National Center for Health Statistics, National Vital Statistics Reports, Volume 60, Number 01, Births: Final Data for 2009, http://www.cdc.gov/nchs/data/nvsr/nvsr60/nvsr60_01.pdf.
- National Center for Health Statistics, National Vital Statistics Reports, Volume 61, Number 5, Births; Preliminary data for 2011, http://www.cdc.gov/nchs/data/nvsr/nvsr61/nvsr61_05.pdf.
- American Community Survey 1-Year Estimates, 2002–2009, 2011, B01001, B01001A & B01001B.
- United States Decennial Census 2010, QTP2. PCT12A & PCT12B.
- Tennessee Department of Health, Office of Policy, Planning and Assessment, Division of Health Statistics, Sexually Transmitted Diseases Data, 2002–2011.
- Centers for Disease Control and Prevention, Sexually Transmitted Disease Surveillance 2002–2011, Atlanta: United States Department of Health and Human Services.
- CDC Wonder, 2003–2009, http://wonder.cdc.gov/natality.html.
