Education
Early education is critical for life-long success.
Experiences during a child’s earliest years will shape the development of fundamental cognitive, behavioral, and language skills that are necessary for learning and thriving upon reaching school.1 During this crucial period, children are developing the foundations for later learning, including how to understand and use language, how to appropriately interact with others, healthy self-confidence, and appropriate self-control.
Exposure to negative early experiences, such as poverty and stress, can adversely affect early development. Research indicates that young children who are raised in poverty are exposed to fewer words, and reach school with smaller vocabularies, than children who are raised in middle-income families.2,3 Poor and low-income children tend to have fewer books and fewer early learning experiences than children raised in middle-class or upper-class homes.4–6 As a result, disadvantaged children often reach kindergarten with greater risk for developmental delays.
Research shows that, upon reaching kindergarten, children who have grown up in poverty can be an entire year behind non-poor children on certain cognitive measures.7 These differences in early development can have life-long implications, potentially translating into
- lower academic achievement
- increased risk of high school dropout
- increased dependence on public assistance
- increased risk of criminality
- lower quality of life8,9
However, positive early childhood experiences promote positive early development and the acquisition of fundamental skills, and can help to reduce the negative influence of developmental risk factors, such as poverty.10
High-quality early education and child care can help promote positive developmental experiences for young children.11
Pre-kindergarten (pre-k), Head Start, and other high-quality structured child care can facilitate children’s readiness to learn upon entering kindergarten, and thus support future academic success. Years of tracking incoming kindergartners in Memphis City Schools (MCS) has demonstrated that children whose parents reported they attended MCS Pre-K, Head Start, or other structured child care consistently scored higher on measures of kindergarten readiness than children who spent the year prior to kindergarten at home or in the care of a relative.12
Pre-kindergarten programs have recently garnered a large amount of interest at the local, state, and national levels. This intense focus has caused many, from parents to policymakers, to wonder exactly how pre-kindergarten programs help support young children, and whether certain children receive the greatest benefit. Data are now available to help answer these questions, in a school district that has nearly doubled its available pre-k slots over the past eight years.
While progress has been made to offer greater access to pre-k in Memphis, there is still greater need than there are available slots.
In MCS last year, 4,100 pre-k slots were available to families with four-year-old children, while approximately 9,000 children would enroll in kindergarten the following year. Because of this shortage, families with the greatest need are given enrollment priority. MCS determines pre-k enrollment priority by screening children’s developmental level and by assessing financial need and other research-based family risk factors associated with lower kindergarten readiness among children.13–16
These risk factors are:
- growing up in a family that struggles financially
- teenage motherhood
- parents with less than a high school education
- having only one parent at home
- children’s difficulty with language
Among last year’s 3,644 applicants to MCS Pre-K for whom data are available,
- most children (71%) had one or two risk factors
- about 14% had three or four risk factors
- about 15% of these children had no risk factors
(Only three children demonstrated all five family risk factors; therefore, this group was not included in the analysis.17)
The Peabody Picture Vocabulary Test measures children’s language skills as they enter pre-k and again at the end of the pre-k year.
After enrollment into pre-k, children’s receptive vocabulary (vocabulary that is understood by the child) is assessed as an indicator of language acquisition. The Peabody Picture Vocabulary Test (PPVT) is used by
MCS at the beginning and end of pre-k, and is a common, age-normed assessment for receptive vocabulary. PPVT scores are standardized based on the child’s age. In other words, a child with the same standard score at age three and age five has been learning increasingly complex and developmentally appropriate vocabulary during those two years.
A PPVT standard score of 100 is equivalent to the 50th percentile, meaning that half of all test takers would be expected to score above 100, and the other half would be expected to score less than 100. A score between 85 and 115 indicates a score within normal limits. A score less than 85 would indicate a concern in the acquisition of vocabulary.
Because PPVT standard scores are interpreted the same way regardless of the age of the child, the scores of children who are of different ages (and therefore of different expected abilities) can be meaningfully compared over time.
At the beginning of the pre-k school year, children with more family risk factors tended to score lower than children with fewer risk factors.
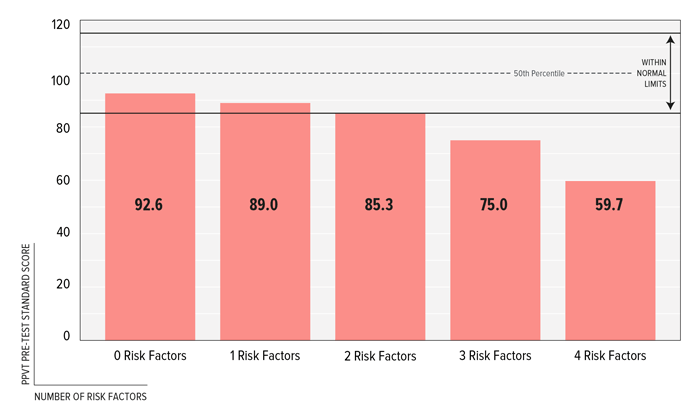
The first PPVT is given at the beginning of the pre-k school year. We found that children with more family risk factors scored lower, on average, than children with fewer risk factors. In fact, with each additional risk factor, children’s PPVT pretest scores decreased significantly, and the range of scores observed was remarkable. Overall, children with four family risk factors scored almost 33 points lower than children who had no risk factors.
FIGURE 1: Beginning PPVT Scores by Number of Family Risk Factors, Memphis City Schools, 2012
FIGURE 1 shows that at the beginning of the pre-k year, children with more family risk factors had, on average, lower language test scores than children with fewer risk factors.

Source: Memphis City Schools, Office of Evaluation. Unpublished Data 2012
The challenge facing the students served by the pre-k program is poignantly illustrated by examining the initial PPVT scores more closely. While the group averages for children with zero, one, or two risk factors are within normal limits for the PPVT, none of the groups reached the 50th percentile. Moreover, the average scores of children with 3 or more risk factors did not even reach the normal range. This is concerning because early vocabulary deficits may herald later deficits in reading comprehension, and could also indicate delays in language acquisition that warrant intervention.4
Furthermore, because these scores are averages for each of these categories, there were children in all groups who scored below the lower end of what is considered normal limits for the PPVT. For example, nearly one half of children with two risk factors scored below 85 points on the first PPVT. Therefore, these students must overcome large vocabulary deficits at the same time they are in the process of mastering the kindergarten curriculum.
By the end of the pre-k year, students in all risk groups made gains on the PPVT.
The second PPVT is given at the end of the pre-k year. Scores from the second PPVT scores show that all five risk groups made gains on the PPVT by the end of the pre-k school year, demonstrating that children’s developing vocabularies were positively influenced over the pre-k year.
Children with more family risks made larger PPVT gains during pre-k.
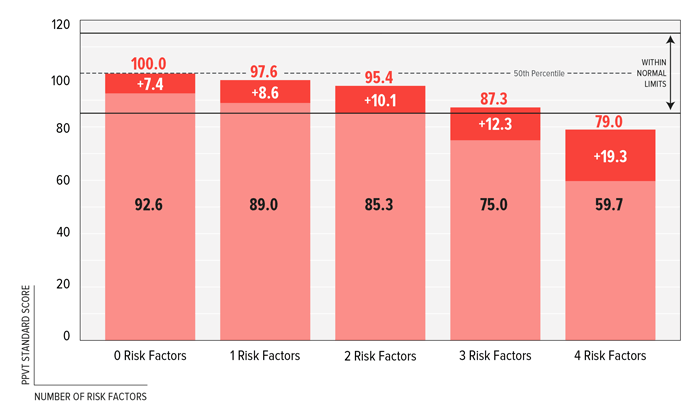
As the number of risk factors increased, differences in averages between the beginning and concluding test also increased. In other words, groups of students with more risk factors made larger gains in vocabulary acquisition, on average, over the course of the year. Despite the evident challenges faced by higher-risk children, their receptive vocabularies were substantially bolstered during the pre-k year.
FIGURE 2: Growth in PPVT Scores Over The Pre-Kindergarten Year by Number of Family Risk Factors, Memphis City Schools, 2012*
FIGURE 2 shows that performance gaps between higher-risk and lower-risk children were substantially reduced by the end of the pre-k year.

Source: Memphis City Schools, Office of Evaluation. Unpublished Data 2012
*Please note that lighter red tones represent scores from the first PPVT, darker red tones represent scores from the second PPVT.
Gaps in PPVT scores between groups of children from different home environments remained at the end of the year.
Despite the remarkable gains made by higher-risk children, averages from the later PPVT remained below the average scores for children with fewer risks. Children from families with the most risk factors ended pre-kindergarten with scores below the lower limit for typical vocabulary acquisition, indicating potential concern. Only the group of children with no family risk factors reached the 50th percentile score.
However, performance gaps were substantially reduced by the end of the pre-k year: scores from the second PPVT indicate the overall gap between children with no risk factors and children with four risk factors was reduced from 32.9 points to 21 points – a difference of almost 12 points.
Pre-k children made remarkable progress, but additional investments could promote even better outcomes.
Because PPVT standard scores account for the influence of age on vocabulary development, it is reasonable to assume that if children remained on the same trajectory at which they entered pre-k, their 61 secondary PPVT scores at the end of pre-k would be very similar to their initial scores at the beginning of pre-k. Instead, all groups of children had substantially higher average scores at the end of the pre-k year, particularly those who had more risk factors and entered pre-k with the lowest scores. Therefore, the intervening year of pre-k clearly made positive and meaningful impact on the development of children’s receptive language skills.
Ongoing support throughout kindergarten and early grades is important to help young children—particularly those at higher risk—continue to learn and thrive in school. Pre-k can provide meaningful developmental support to young children, but cannot remove pre-existing risk factors from the picture. A sustained effort to support all families with young children is vital to help blunt the negative effects these factors have on early development and future academic success.
These results suggest that all children, especially those at greatest risk for developmental delays, should receive meaningful support from pre-k programs and reach kindergarten with greater capacity to succeed and thrive in school. Moreover, other methods of supporting families and their young children’s development are also important, particularly in the years before school begins. High-quality intervention in the earliest years yields the greatest return on investment by promoting optimal development, thereby helping to set young children on a positive early trajectory for success in school and in later life.1,18,19
- Duncan GJ, et al. School readiness and later achievement. Developmental Psychology. 2007; 43(6):1428–1446.
- Hart B, Risley RT. Meaningful Differences in the Everyday Experience of Young American Children. Baltimore: Paul H. Brookes; 1995.
- Zimmerman FJ, et al. Teaching by listening: The importance of adult-child conversations to language development. Pediatrics. 2009; 124(1):324–349.
- Snow CE, Burns MS, Griffin P. (Eds.). Preventing Reading Difficulties in Young Children. Washington, DC: National Academy Press; 1998.
- Hoff E. The specificity of environmental influence: socioeconomic status affects early vocabulary development via maternal speech. Child Development. 2003; 74(5):1368–1378.
- Serpell R, et al. Intimate cultures of families in early socialization of literacy. Journal of Family Psychology. 2002; 16(4):391–405.
- Stipek DJ, Ryan RH. Economically disadvantaged preschoolers: Ready to learn but further to go. Developmental Psychology. 1997; 33(4):711–723.
- Barnett WS, Belfield CR. Early childhood development and social mobility. Future Child. 2006; 16(2):73–98.
- Campbell FA, et al. Young adult outcomes of the Abecedarian and CARE early childhood educational interventions. Early Childhood Research Quarterly. 2008; 23(4):452–466.
- Braveman P, et al. Early childhood experiences: Laying the foundation for health across a lifetime. 2008. Retrieved from http://www.commissiononhealth.org/PDF/095bea47-ae8e-4744-b054-258c9309b3d4/Issue%20Brief%201%20Jun%2008%20-%20Early%20Childhood%20Experiences%20and%20Health.pdf.
- Barnett WS. Benefits of preschool for all. Retrieved from http://nieer.org/resources/files/Benefits.pdf.
- Sell M. The effects of pre-k experience on Kindergarten Readiness Indicator scores: 4 year trends. Memphis City Schools Office of Evaluation. 2009. Retrieved from http://mcsk12.worldspice.net/rea/docs/Data/PreK/Effects%20of%20Pre-K%20Experience%20on%20KRI%20Scores%20-%204%20Year%20Trends.pdf.
- Lee VE, Burkam DT. Inequality at the Starting Gate: Social Background Differences in Achievement as Children Begin School. Washington, D.C.: Economic Policy Institute; 2002.
- Magnuson K, Duncan G. The role of family socioeconomic resources in racial test score gaps. Developmental Review. 2006; 26:365–399.
- Magnuson K, Duncan G. Inequality in preschool education and school readiness. American Educational Research Journal. 2004; 41:115–157.
- The Urban Child Institute. Research to Policy January 2011: The Implications of Teen Parenting for Early Childhood Development in Memphis. 2011. Retrieved from http://www.theurbanchildinstitute.org/articles/research-to-policy/overviews/the-implications-of-teen-parenting-for-early-childhood.
- The Urban Child Institute. The State of Children in Memphis and Shelby County: Data Book. Memphis, TN: The Urban Child Institute; 2012.
- Camilli G, et al. Meta-analysis of the effects of early education interventions on cognitive and social development. Teachers College Record. 2010; 112(3):579–620.
- Isaacs JB. Cost-Effective Investments in Children. Washington, DC: The Brookings Institution; 2007.
